A few days ago, I shared a data visualization I did for the North American Vexillological Association (NAVA) to support their international press release on a flag survey they did in late 2022. Today, I have the analytical one ready, intended more for research, or to find things to research and answer among the results.
data
Words to End a Book With… or Not
 If you were writing a book, after tens of thousands of words, possibly over a hundred words, would you care what would be your last word? And if you did, what would it be? Or perhaps, more realistically, what wouldn’t it be? Or maybe what wouldn’t it be along the lines of? I would never have cared before today, because I had never thought of it. However, I got an unintended prompt a few days ago that, from now on, I will commit to caring.
An Interactive Analysis Suite for Google COVID-19 Mobility Data
I recently completed an interactive analysis suite for Google’s COVID-19 mobility data, to let me (and others) do all kinds of comparisons one simply cannot get close to with those static Google mobility data reports! Unfortunately, you will have to go to the Tableau public site, the platform on which I built it, to see and use it because I cannot embed webpages with JavaScript in the WordPress platform this blog is built on.
The Tableau “viz” analysis suite lets you do things like compare for any time period for which Google gave daily data, and even between two time periods. You can also compare any number of countries, regions, even US counties, with data filters. You can compare habits over the days of the week, or see what mobility behaviors people changed (or didn’t, on individual days in a range days). There are “fair expectations” set for each metric based on average to slightly above performance shown to be attainable over a 6 week period, to give further context to the numbers. There is a population filter to compare countries in select ranges of populations. Finally, there are ranks so you don’t have to memorize any numbers in comparing performance in different places and/or over different times. Lots of stuff you can do all kinds of analytics with, draw conclusions about (though be careful on assumptions), and such!
The Tableau viz will be updated roughly once a week, when Google puts out the latest data set. It doesn’t seem they’ll be too consistent with when they do that, but only varying between Thursday and Friday so far. In that Tableau viz is:
- A table of content tab (at top of view) outlining what is in each tab;
- A map of the world showing how countries compare for each of the 6 metrics;
- Continental maps showing regional breakdowns in each country on the continent (where there is data);
- Even a US county breakdown map;
- Graphs showing ranks of countries and regions (US counties were too spotty with incomplete data for me to care and give it its own comparison dashboard);
- Graphs showing select regions against others, allowing comparisons between countries and smaller regions like states and provinces, for example;
- Graphs showing results over time;
- Bundled sets of charts in logical order to produce what would be a good briefing report, without text that someone could write for their region/s if they wanted to; and
- Lots more!
Please click on the link if you want to test out the analytical suite I built. It’s free! No ads or anything! 🙂
Thanks!
A Case for More Gun Control Using Gun Lobbyist Data
I owe this post to a pro-gun friend who debated me on more gun control. His arguments and stats used, including the graph below, led me to do the degree of research I did to counter, which I used here. I didn’t convince him, which I didn’t expect to, but you can judge for yourself from what I present following. I thought it might be valuable for people to understand the flaws in many anti-gun control, if not pro-gun, arguments presented, coming from someone who does analysis of all sorts for a living.
I was shown the graph below with data showing why tighter gun control was not the solution to America’s gun problem with gun related deaths and incidents. What I, as a professional analyst, saw, instead, was the very reasons why America needs tighter gun control. I will also counter a bunch of other points brought up by gun lobbyists that doesn’t involve data, because it isn’t just about the data, of course. But let’s first look at one graph with lots of data.

US Firearms, Deaths and Population Trends
Continue reading
Star Trek Facebook Picture Tagging Meme
I know that Star Trek is a HUGE franchise that is not only big currently but also has endured the test of time and has fans as passionate as any. Yet, there are no Star Trek Facebook picture tagging meme. Are Trekkers too serious and mature to do this sort of stuff? Not hardcore enough for Trekkers who have to suit up, part fingers and utter Klingon to have fun? I like to think not, but we’ll see. I’ve made an extra large collage of 25 Star Trek characters, compared to other versions listed below with 15-20 characters mostly, because I think any Trekker willing to use this will have many other Trekkers s/he can tag. Enjoy!
Here’s how to get this graphic for your Facebook fun:
- Click on the picture below to get it at full size.
- Right click on that picture and save to your computer.
- Upload it to your Facebook profile.
- Tag your friends!
-
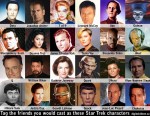
- Star Trek Casting
-

- Star Trek character tagging
Please click here for a complete list of over 100 Facebook picture tagging memes on this site with which you can use for fun with your friends.
NEW to this site if you like Star Trek!
- 1024×768 pixels wallpapers from Star Trek TOS, TNG, DS9, Voyager, Enterprise, Movies (also good for 800 x 600 and 640 x 480 monitors) — 109 wallpapers
- 1280×960 pixels from Star Trek TOS, TNG, DS9 Voyager, Enterprise, Movies (also good for 1152 x 864 monitors) — 109 wallpapers
- 1280×1024 pixels, from Star Trek TOS, TNG, DS9, Voyager, Enterprise, Movies — 108 wallpapers
- 1440 x 960 pixels, from Star Trek TOS, TNG, DS9, Voyager, Enterprise, Movies — 101 wallpapers
- 1600×1200 pixels, from Star Trek TOS, TNG, DS9, Voyager, Enterprise, Movies — 109 wallpapers
- 1920×1080 pixels, from Star Trek TOS, TNG, DS9, Voyager, Enterprise, Movies — 103 wallpapers
- 1920×1200 pixels, from Star Trek TOS, TNG, DS9, Voyager, Enterprise, Movies (also good for 1680 x 1050, 1440 x 900, 1280 x 800 and 960 x 600 pixel monitors) — 105wallpapers
facebooktagger stole this from me, it was stolen by facebooktagger, you know facebooktagger.

