Can you name 500 US cities and towns? What about 300 Canadian municipalities (cities, towns, villages, etc.)? For what you can name, can you picture their flags?
map
An Interactive Analysis Suite for Google COVID-19 Mobility Data
I recently completed an interactive analysis suite for Google’s COVID-19 mobility data, to let me (and others) do all kinds of comparisons one simply cannot get close to with those static Google mobility data reports! Unfortunately, you will have to go to the Tableau public site, the platform on which I built it, to see and use it because I cannot embed webpages with JavaScript in the WordPress platform this blog is built on.
The Tableau “viz” analysis suite lets you do things like compare for any time period for which Google gave daily data, and even between two time periods. You can also compare any number of countries, regions, even US counties, with data filters. You can compare habits over the days of the week, or see what mobility behaviors people changed (or didn’t, on individual days in a range days). There are “fair expectations” set for each metric based on average to slightly above performance shown to be attainable over a 6 week period, to give further context to the numbers. There is a population filter to compare countries in select ranges of populations. Finally, there are ranks so you don’t have to memorize any numbers in comparing performance in different places and/or over different times. Lots of stuff you can do all kinds of analytics with, draw conclusions about (though be careful on assumptions), and such!
The Tableau viz will be updated roughly once a week, when Google puts out the latest data set. It doesn’t seem they’ll be too consistent with when they do that, but only varying between Thursday and Friday so far. In that Tableau viz is:
- A table of content tab (at top of view) outlining what is in each tab;
- A map of the world showing how countries compare for each of the 6 metrics;
- Continental maps showing regional breakdowns in each country on the continent (where there is data);
- Even a US county breakdown map;
- Graphs showing ranks of countries and regions (US counties were too spotty with incomplete data for me to care and give it its own comparison dashboard);
- Graphs showing select regions against others, allowing comparisons between countries and smaller regions like states and provinces, for example;
- Graphs showing results over time;
- Bundled sets of charts in logical order to produce what would be a good briefing report, without text that someone could write for their region/s if they wanted to; and
- Lots more!
Please click on the link if you want to test out the analytical suite I built. It’s free! No ads or anything! 🙂
Thanks!
A Life Strategy Map Draft – Part 1
I am in the midst of designing the next phase of my life, as per the course at Stanford, taught through the book of the same name. In my own innovation to this process, I created what I called a Life Strategy Map (diagram below) to clarify for myself what I really wanted out of life so I can focus my living as much as possible towards achieving outcomes on that map. Since I had, both, the diagram and supporting explanatory text for me to be able to use it, I thought I’d share in case anybody wanted to try the same thing for themselves.
I’ll start with explaining what a Life Strategy Map is, and what it’s supposed to do, along with some instructions on getting the right level of details in it. In a few follow-up posts, I’ll go through mine in hopes it may clarify examples for you, and/or give you ideas for your own Life Strategy Map if you should want to try the exercise.

Star Trek 1600×1200 Wallpapers (TOS, TNG, DS9, Voyager, Enterprise, Movies)
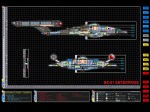
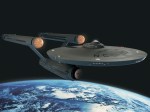
These images are 1600 x 1200 pixels in size. I found them in all sorts of formats, touched them up and cropped them for these wallpapers. There are over 100 wallpapers here, and I will be putting up more. So if you have trouble deciding which one to use, I hope you’ll come back to pick a different one every now and then.
If you’re using Windows XP, you can learn how to create your own customized Windows XP screen saver with instructions via this link.
I also have instructions for how to use Windows 7′s nice rotating background feature to rotate many of these wallpapers on your computer if you didn’t know how to enable it.
I hope you will enjoy these wallpapers! You can find more awesome Star Trek wallpapers at The Light Works’ website.
Most of these wallpapers below are also available in other monitor sizes:
- 1024 x 768 pixels
- 1280 x 960 pixels
- 1280×1024 pixels
- 1440 x 960 pixels
- 1920 x 1080 pixels
- 1920 x 1200 pixels
Please click here to get these wallpapers as printable high resolution 6″ x 4″ photos!
Please click here to get wallpapers of other themes on this site.
![]()
-

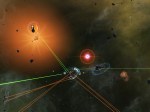
- Battle scene
-
- Borg battle scene
-

- Borg battle scene
-

- Borg cubes
-

- Borg logo
-

- Cardassian Galor class
-

- Chaffe?
-
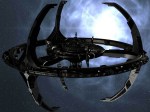
- Deep Space Nine (DS9)
-
- USS Defiant
-

- USS Defiant (old)
-

- USS Defiant
-
- Delta flyer
-
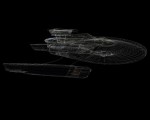
- USS Deus Irae
-

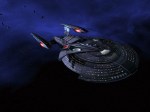
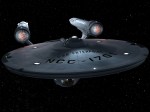
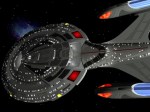
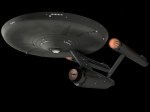
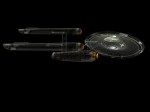
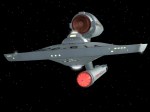
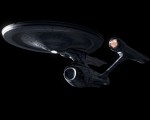
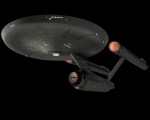
- USS Enterprise
-

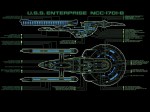
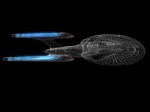
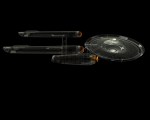
- USS Enterprise
-
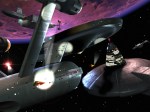
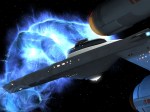
- USS Enterprise
-
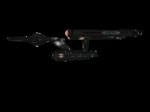
- USS Enterprise / USS Botany Bay
-

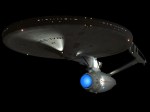
- USS Enterprise
-

- USS Enterprise
-

- USS Enterprise
-
- USS Enterprise
-

- USS Enterprise
-

- USS Enterprise
-
- USS Enterprise
-
- USS Enterprise
-

- USS Enterprise
-
- USS Enterprise
-

- USS Enterprise
-
- USS Enterprise
-

- USS Enterprise
-
- USS Enterprise
-

- USS Enterprise
-
- USS Enterprise
-

- USS Enterprise
-

- USS Enterprise
-
- USS Enterprise
-

- USS Enterprise
-

- USS Enterprise
-
- USS Enterprise
-
- USS Enterprise
-
- USS Enterprise
-

- USS Enterprise
-
- USS Enterprise
-

- USS Equinox
-

- USS Excelsior
-

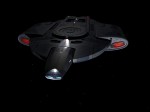
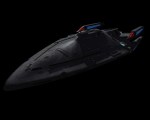
- Fleet escort
-

- Hirogen ship
-

- USS Kelvin
-
- USS Kelvin
-

- Kirk
-

- Kirk
-

- Kirk
-

- Klingon battle cruiser
-
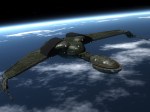
- Klingon Bird of Prey
-

- Klingon Bird of Prey
-

- Nero
-

- Nero
-

- Nero
-

- USS Prometheus
-

- USS Prometheus
-

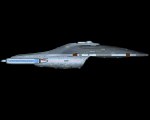
- USS Reliant
-

- USS Reliant
-

- USS Reliant
-

- USS Sagan
-

- Space docks
-

- Spock
-

- Spock
-

- Spock
-

- Star Fleet Headquarters
-

- Star Trek movie cast / logo
-

- Star Trek Logo
-

- Star Trek movie cast
-
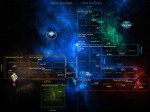
- Star Trek map
-

- Starships
-

- Starships
-

- Starships
-

- Uhura
-

- United Federation of Planets logo
-

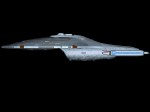
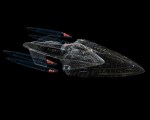
- Voyager
-

- Voyager
-

- Voyager
-

- USS Voyager
-
- Voyager
-

- Voyager
-

- Voyager
-

- Voyager
-

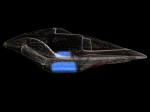
- Vulcan ship
-

- Xindi
-

- Xindi
-

- Xindi
Star Trek 1280×1024 Wallpapers (TOS, TNG, DS9, Voyager, Enterprise, Movies)
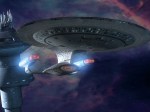
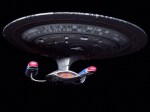
These wallpapers are 1280 x 1024 pixels in dimension. I found them mostly in widescreen format, touched them up and cropped them for these wallpapers. Their original widescreen format meant some things got slightly cut off, but in some cases, better have that than nothing. There are over 100 wallpapers here, and I will be putting up more. So if you have trouble deciding which one to use, I hope you’ll come back to pick a different one every now and then.
If you’re using Windows XP, you can learn how to create your own customized Windows XP screen saver with instructions via this link.
I also have instructions for how to use Windows 7′s nice rotating background feature to rotate many of these wallpapers on your computer if you didn’t know how to enable it.
I hope you will enjoy these wallpapers! You can find more awesome Star Trek wallpapers at The Light Works’ website.
Most of these wallpapers are also available in other monitor sizes:
- 1024 x 768 pixels
- 1280 x 960 pixels
- 1440 x 960 pixels
- 1600 x 1200 pixels
- 1920 x 1080 pixels
- 1920 x 1200 pixels
Please click here to get these wallpapers as printable high resolution 6″ x 4″ photos!
Please click here to get wallpapers of other themes on this site.
![]()
-

- Battle scene
-

- Borg battle scene
-

- Borg battle scene
-

- Borg cubes
-

- Borg logo
-

- Cardassian Galor Class
-

- Chaffe?
-

- Deep Space Nine (DS9)
-

- USS Defiant
-

- USS Defiant (old)
-

- USS Defiant
-

- Delta flyer
-

- USS Deus Irae
-

- USS Enterprise
-
- USS Enterprise
-

- USS Enterprise
-
- USS Enterprise / USS Botany Bay
-

- USS Enterprise
-

- USS Enterprise
-
- USS Enterprise
-

- USS Enterprise
-

- USS Enterprise
-

- USS Enterprise
-

- USS Enterprise
-

- USS Enterprise
-

- USS Enterprise
-
- USS Enterprise
-

- USS Enterprise
-

- USS Enterprise
-

- USS Enterprise
-

- USS Enterprise
-

- USS Enterprise
-

- USS Enterprise
-

- USS Enterprise
-

- USS Enterprise
-

- USS Enterprise / USS Stargazer
-

- USS Enterprise
-
- USS Enterprise
-

- USS Enterprise
-
- USS Enterprise
-

- USS Enterprise
-
- USS Enterprise
-

- USS Equinox
-

- USS Excelsior
-

- Fleet escort
-

- Hirogen
-

- USS Kelvin
-

- Kirk
-

- Kirk
-

- Kirk
-

- Klingon battle cruiser
-

- Klingon Bird of Prey
-

- Klingon Bird of Prey
-

- Nero
-

- Nero
-

- Nero
-
- USS Prometheus
-
- USS Prometheus
-

- USS Reliant
-

- USS Reliant
-
- USS Reliant
-

- USS Sagan
-

- Space docks
-

- Spock
-

- Spock
-

- Spock
-

- Star Fleet Headquarters
-

- Star Trek Cast
-

- Star Trek cast & logo
-

- Star Trek logo
-

- Star Trek Universe
-

- Starships
-

- Starships
-

- Starships
-

- Uhura
-

- United Federation of Planets logo
-

- USS Voyager
-

- USS Voyager
-

- USS Voyager
-

- USS Voyager
-

- USS Voyager
-
- USS Voyager
-

- USS Voyager
-

- USS Voyager
-

- Vulcan
-

- Xindi
-

- Xindi
-

- Xindi
