 It’s one of my favourite time of the year, March Madness with the NCAA Men’s Basketball Championship Tournament, and I’m so happy the tournament’s on again after COVID shut it down last year. Still, it isn’t the same without the fans, a weak North Carolina Tar Heels team that is my favourite, and neither perennials of Duke nor Kentucky, as much as despise those teams. It’s all a little less mad than other years, but still mad, as shown by the first big upset almost out of the gates with #15 ranked Oral Roberts upsetting #2 seed Ohio State.
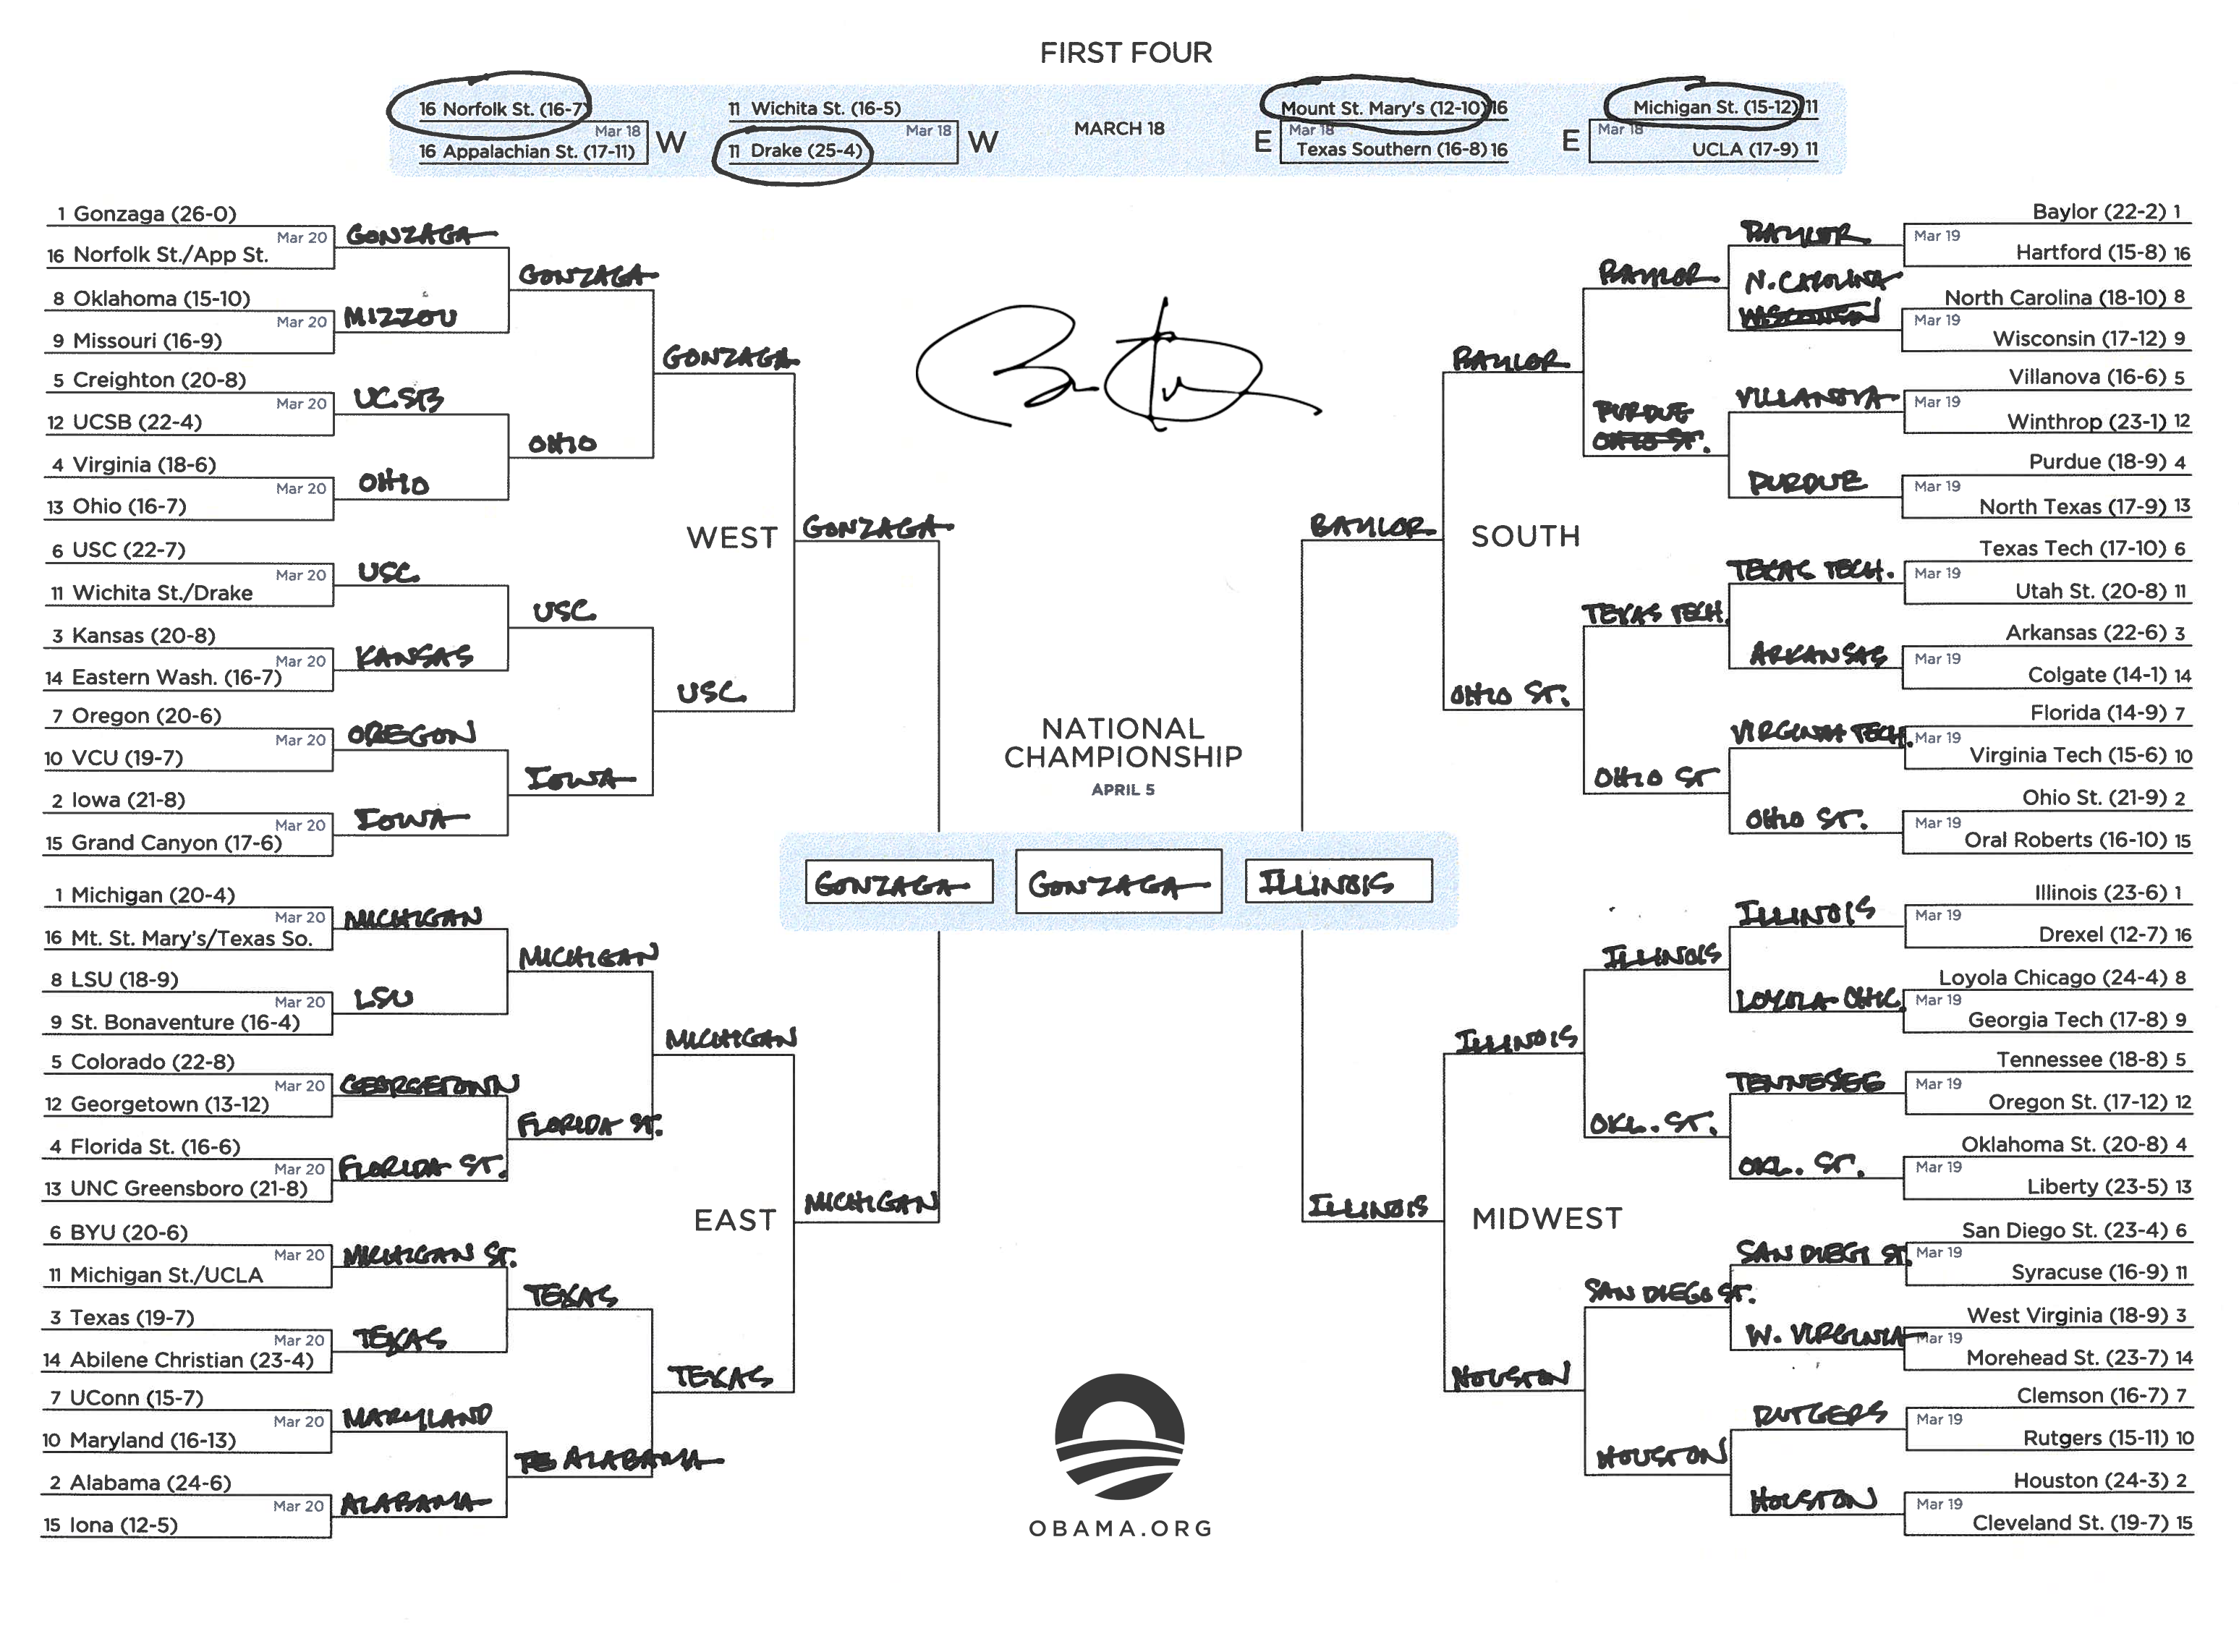
Part of the reason why I love March Madness that isn’t too affected by the lack of fans is the betting pools known as filling out the “brackets” to try and predict as many winners as possible, with more weight towards the championship games. It’s funner when I can beat former President Obama in his Barackets, which I usually do. You can when you can usually beat 95-99% of the brackets entered Here’s the former prez’s Barackets for 2021.
Now, I’m not a huge TV watcher, never mind NCAA basketball watcher. I don’t even have cable in Canada to watch the games. So my joy in predicting brackets is by some data analytics, and some reading to correct for things stats can’t tell me like recent injuries that leaves a different team than the one on the stat sheet. That and a few other things like how North Carolina was the least experienced team in the field and who went against five seniors in Wisconsin, neither of which I knew about in my predictive modeling… and to which I am listening to now as I write this.
So what do I do for predictive modeling?
Well, for starters, I fill out three brackets based on some default ratings. That is, I take the top team and send it all the way to the champion in the brackets. Then I take the second team and take it as far as it goes before it runs into the top team. Then move the third team in the brackets as far as it can go before hitting the path of a team already there, until the brackets are filled out. The three default ratings brackets I fill out are:
- Jeff Sagarin Overall Rankings
(best system usually) - Ken Pomeroy Rankings
(another well known system) - People’s Choice
(usually straight up tournament rankings, to compare the collective “intelligence”)
Doing these brackets also familiarize me with the teams, records, match-ups at stake, paths to the final, and so on. Background info for analysis to come.
Of these systems, I find the Sagarin stats the ones I care the most about, which also happens to be the best ones from years past, so that’s what I study to start deviating. However, before I do that, I make a few more systematic ranking brackets because Sagarin’s system gives a handful of rankings based on what is weighted most. Of these, I took:
- Recent Hot
(who’s been playing well lately) - Predictor
(ranking by scores only)
Now comes the real fun. The reason why I love the Sagarin ratings is because it has a “strength of schedule” field. Team records are somewhat useful, but somewhat meaningless as well because what kind of teams did these teams play? Someone could have a great record because they’re a good team that played only mediocre teams. On the other hand, a great team could play mostly only other great teams and only end up with a good record, but they could beat most teams in the country. So for some warm-up analyses, I create some formulae for columns in Excel to get me new systematic rankings based on things as equally weighted recent ratings and full year ratings, among other things. These brackets were:
- 50-50 Recent & Season
(50% weights for recent rankings & 50% for season rankings to factor in consistency as well as recent streak direction, with some influence for recent performance) - Record & Schedule Strength
(winning percentage multiplied by schedule strength rating, then ranked) - Record & Schedule Strength – 59
(as above, except the schedule strength rating is not the value given, about 59-84, but rather than rating minus 59 because it’s like human weight, you can’t be 0 to make 0 the other end of your range, so you have to
With enough feel for all the key factors important to me now, I did my most careful analysis is to look at the rank of each pair of teams that played, and quickly check how their schedule strengths compared, along with records against Top 25 teams in the nation when they played, as well as Top 50 teams, out of over 350 teams. From these factors, I do a “gut feel” for what I should weigh most, like is the ranking gap too big for the small strength of schedule difference, or is the gap too small for the large schedule strength difference? I feel I can do this now from familiarization of how various factors affected overall rankings. For this analysis, I created the aptly named:
- Human Analytics
(“gut feel” considering ranking gap and schedule of strength, records against top teams, among other factors)
At this time, I do some reading on what some sportswriters pick for surprises and see if any can convince me to change my mind on that latest pool. I try not to let hype influence me, but rather facts like how Georgia Tech’s best player wouldn’t be playing in their #9 vs #8 matchup vs Loyola-Chicago. That’s plenty to change my mind, rather than someone just thinking some team had a style or an unknown offense or defense giving another team trouble. I also change my previous systematic brackets for items like that so that the model can be truer to their stats rather than rated against X-factors it couldn’t fairly account for. If I had to choose one bracket among the handful I picked rather than analyzed by systematic analytics, this bracket would be it.
Being fairly familiar with all the teams’ stats now, I made few other brackets based on some general principles:
- Big Conference Tops
(weighing more on the Big 10 and Big 12 teams who were in really tough conferences so many had mediocre records against a whole whack of tough teams, which seems logical but isn’t turning out well to start with some Big 10 teams losing in big upsets like Ohio State and Purdue, though others are doing super well like Illinois and Wisconsin) - Only Human
(like Human Analytics, but with more influence and risk from some sportswriters’ opinions) - Dozen Upsets
(most risky with at least a dozen upsets)
With 12 brackets, and being 13-respecting rather than fearing with triskaidekaphobia, I stopped picking more brackets and left my set of brackets to be these. It is my hope that one of my personally picked brackets will end up on top, or at least one of my systematic ones, as it would show my own analytics had some value beyond these heavy algorithm models for at least this year’s scenario. If I had documented my performance so well in past years, I would be able to show you this were true reasonably consistently that it’s far truer than not. I would also hope to do better than the straight up tournament rankings, as well as the People’s Brackets, which I do every year so that’s no fluke. However, let’s just enjoy this year’s March Madness and see how it goes. More blog posts over the next two weeks and a half on this topic to track progress!
1252 words
